📈📉 Regularly updated alerts on significant market movements.
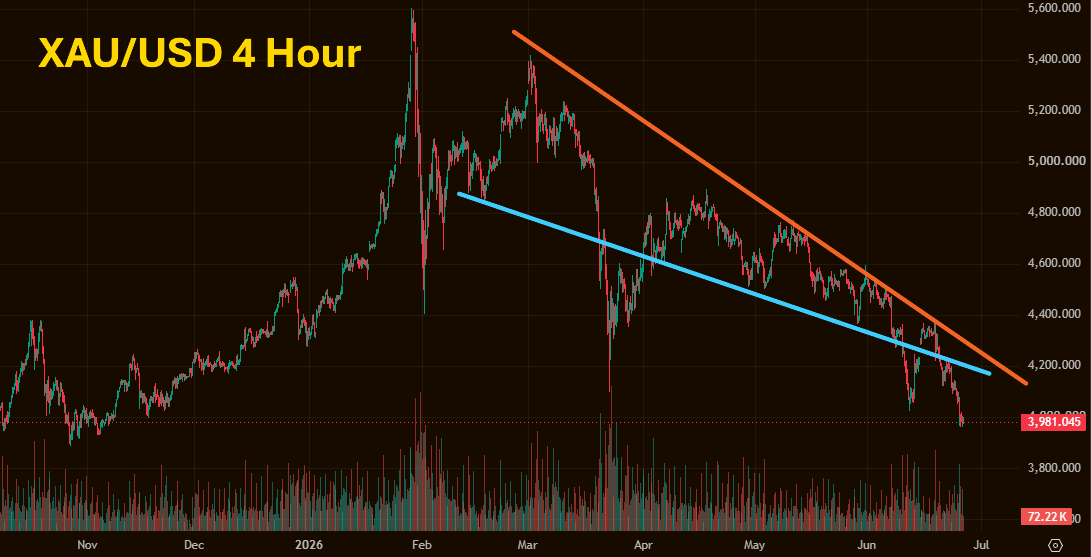
24-25 June 2026
Gold pressured under $4,000/oz on strong U.S. dollar and hawkish Fed signals.
View full price chart
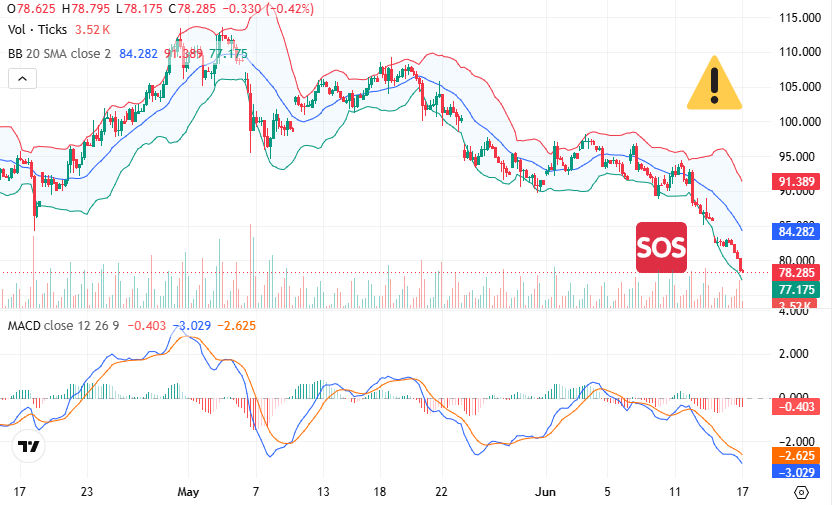
16-17 June 2026
Brent crude slips below $80 a barrel on improved supply outlook after the U.S.–Iran deal.
View full price chart
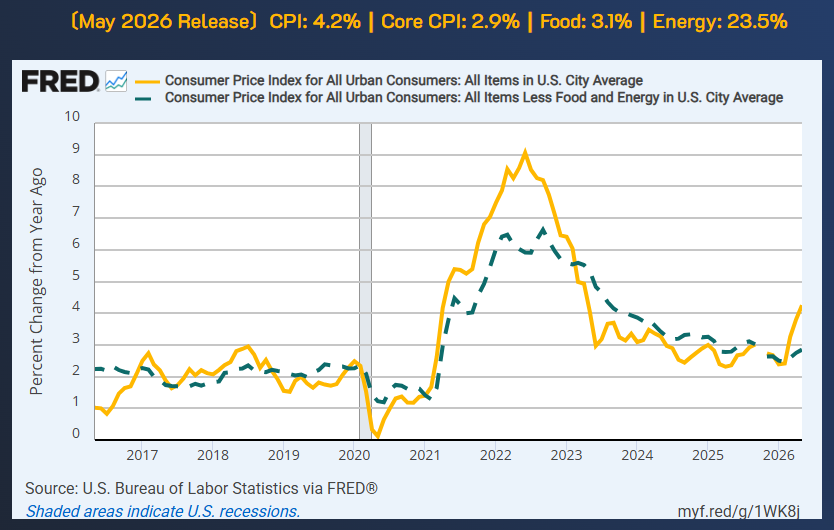
11 June 2026
U.S. May consumer inflation vaults above 4% as the Iran war lifts energy costs. Gold spot sinks below $4,050/oz.
View full U.S. CPI chart
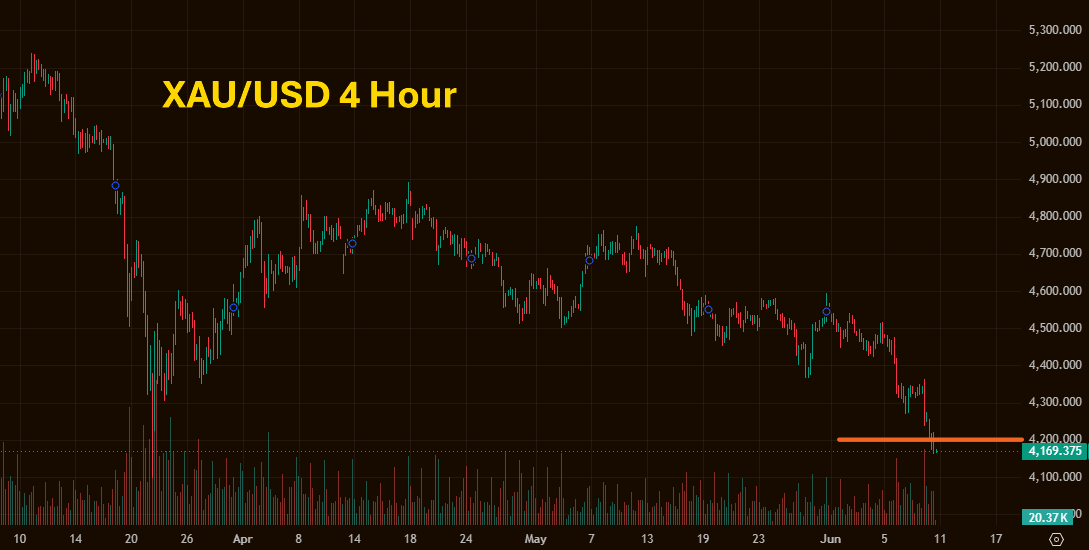
10 June 2026
Spot gold tumbles below $4,200/oz as selling pressure intensifies.
View full price chart
5 June 2026
Strong May U.S. nonfarm payrolls (+172k) thoroughly overturn rate‑cut expectations. Spot gold slides below the $4,350/oz mark.
View full price chart
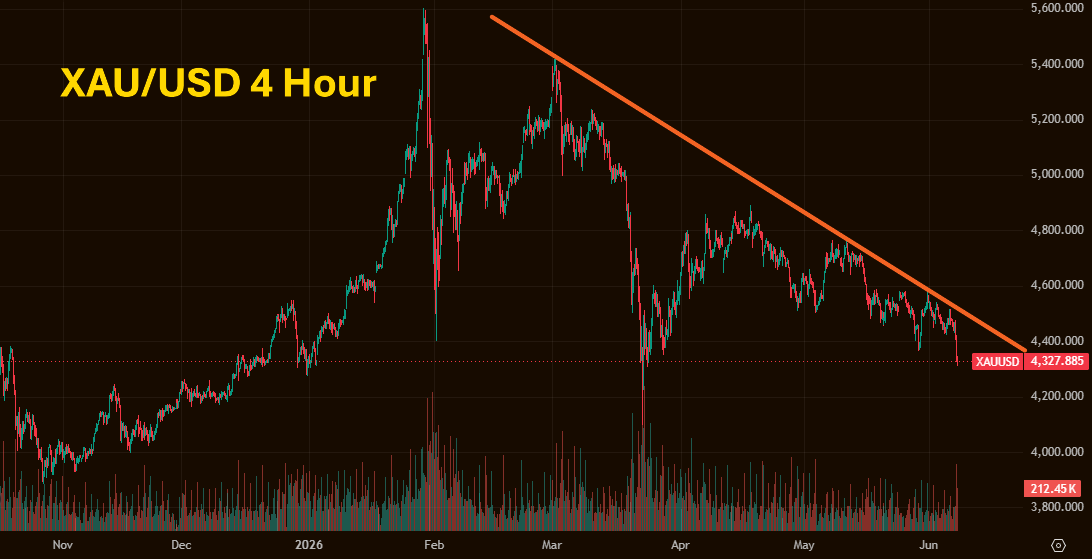
27-28 May 2026
Gold extends decline on U.S.-Iran tensions, slipping below $4,400/oz to a nearly two-month low.
View full price chart
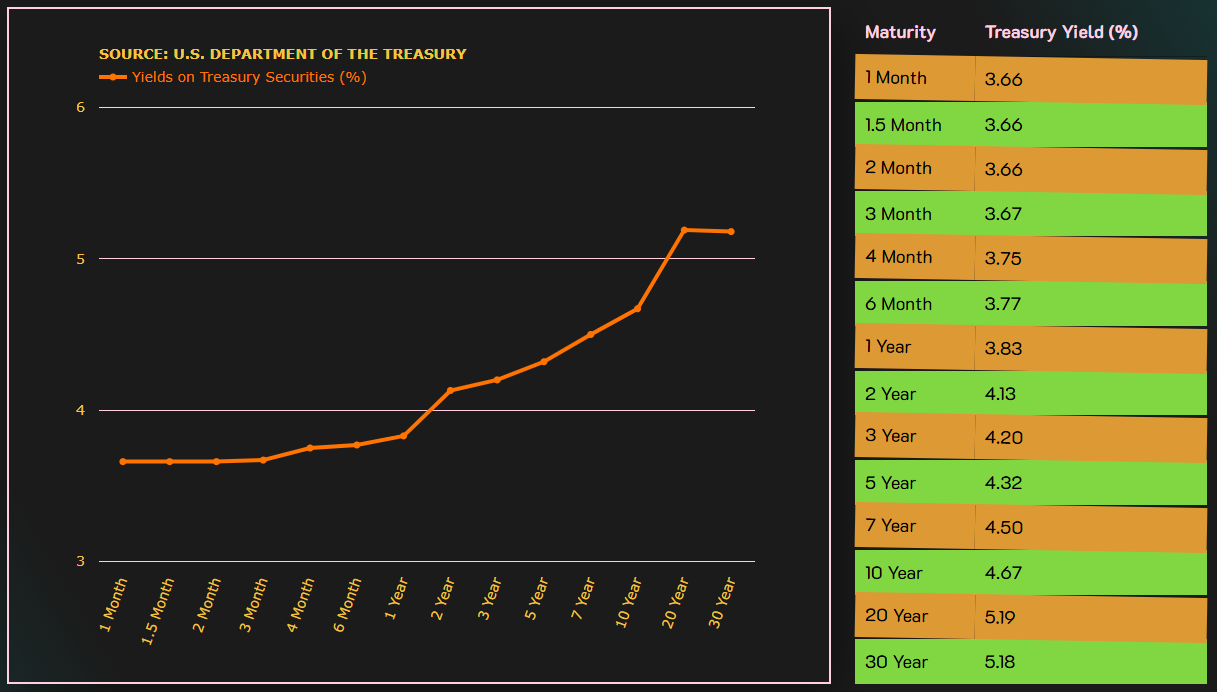
19-20 May 2026
The selloff in government bonds intensified on Tuesday, pushing the 30-year Treasury yield to its highest level since 2007. U.S. Treasurys are entering a “danger zone”.
View full price chart
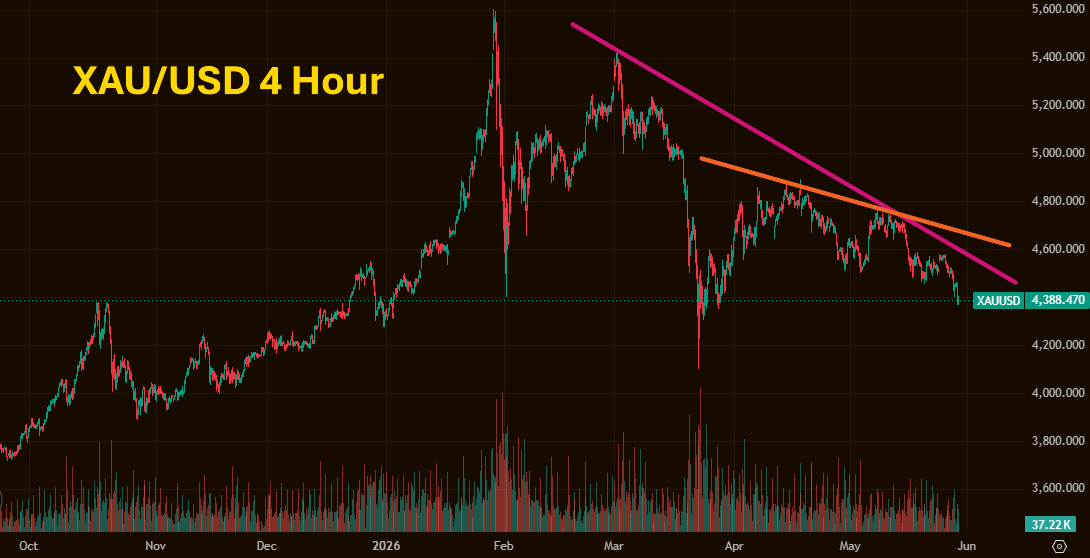
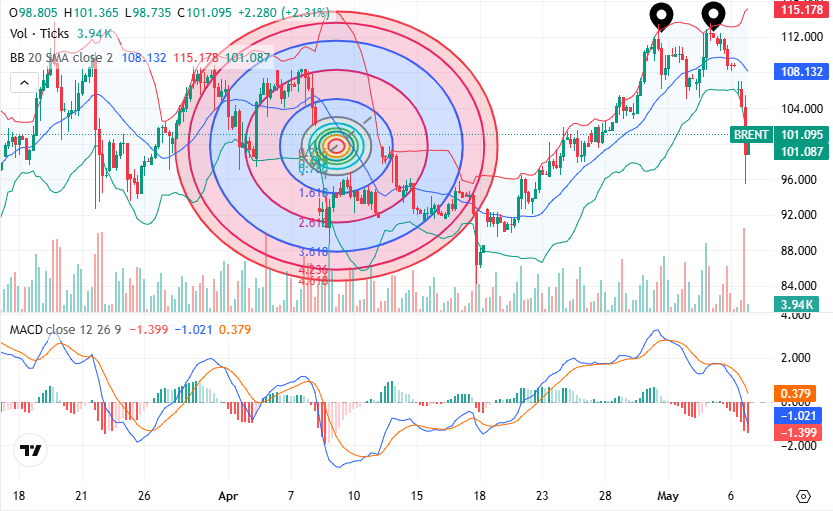
19 May 2026
Rising U.S. Treasury yields, a strengthening U.S. dollar, and resilient oil prices are collectively exerting bearish pressure on spot gold.
View full price chart
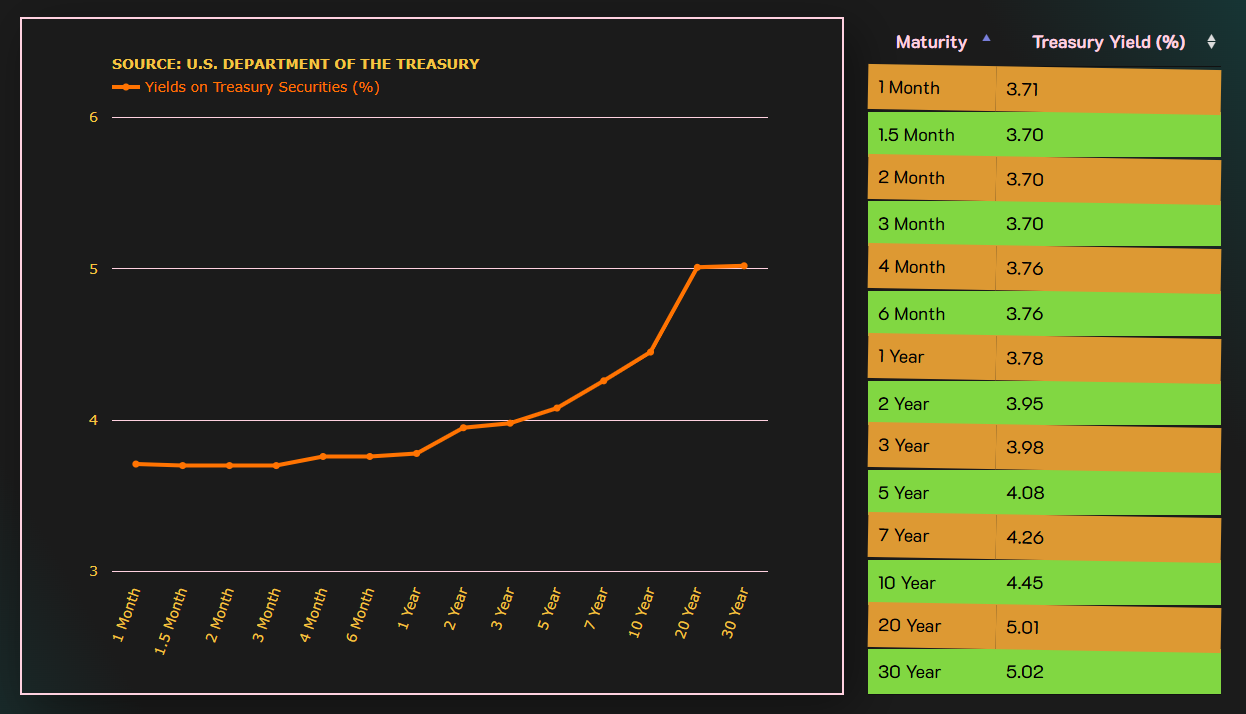
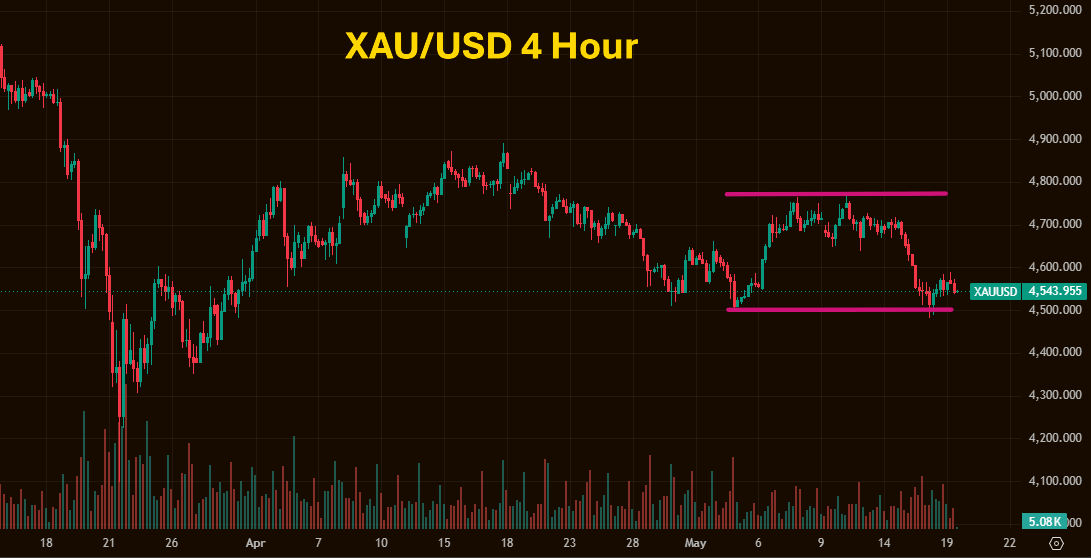
4 May 2026
The 30‑year U.S. Treasury yield pushing above 5% is intensifying downside pressure on precious metals, with higher long–end rates strengthening the dollar and raising the carry cost of holding non‑yielding gold and silver.
View full price chart
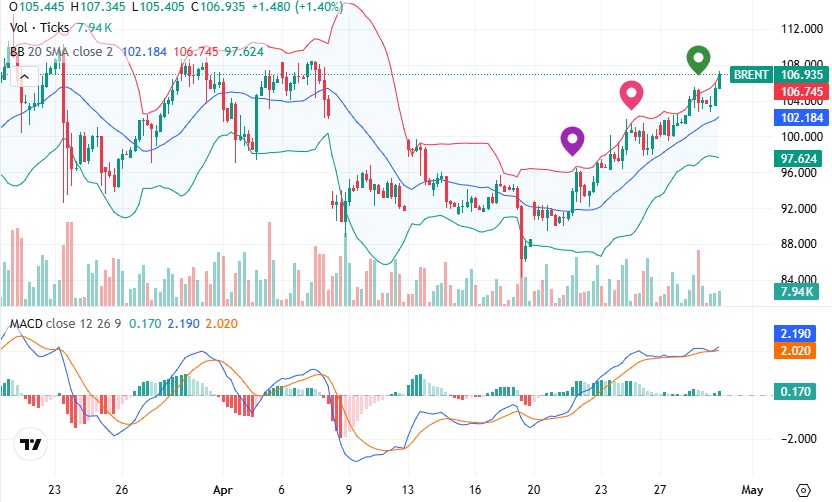
28-29 April 2026
Brent crude remains resilient despite the UAE’s exit from OPEC, while the US–Iran ceasefire hangs in the balance.
View full price chart
24 April 2026
Gold has turned bearish following renewed U.S. naval blockade actions in the Strait of Hormuz.
View full price chart
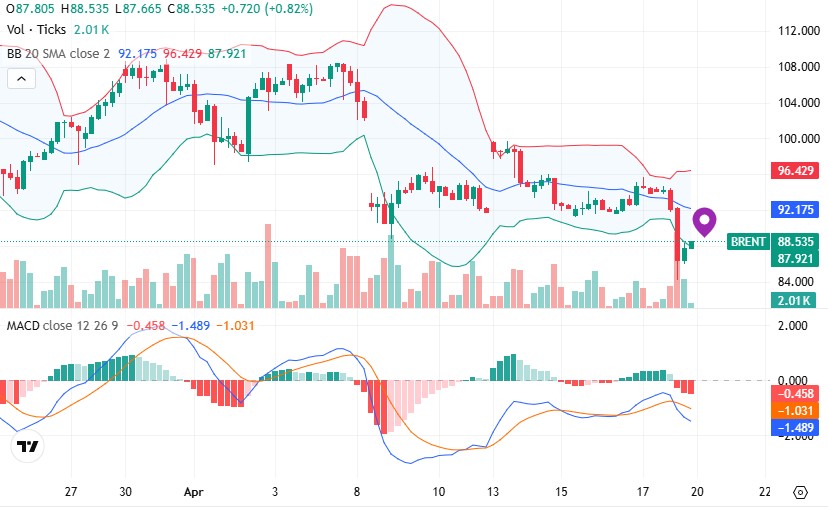
17 April 2026
Brent crude weakens following Iran’s reopening of the Strait of Hormuz to commercial vessels, easing concerns over global oil supply disruptions.
View full price chart
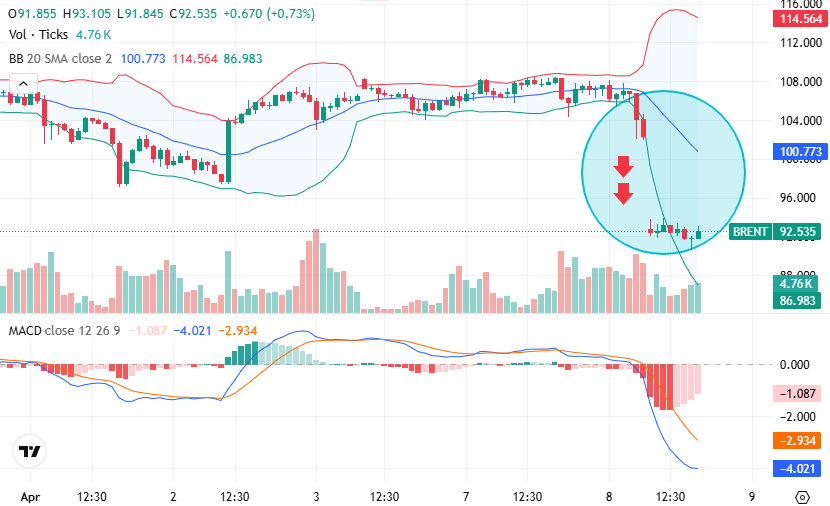
8 April 2026
Oil prices plunge below $93 a barrel after U.S. and Iran agree to a 2‑week ceasefire to reopen the Strait of Hormuz.
View full price chart
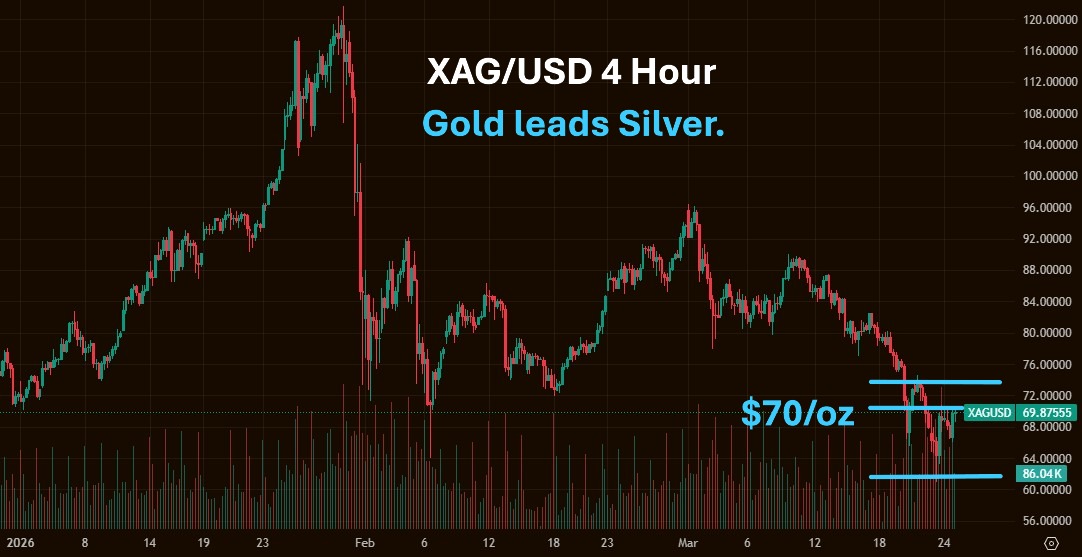
23-24 March 2026
Silver, a higher-beta satellite, trails gold’s bearish moves, dipping to about $61/oz before retesting.
View full price chart
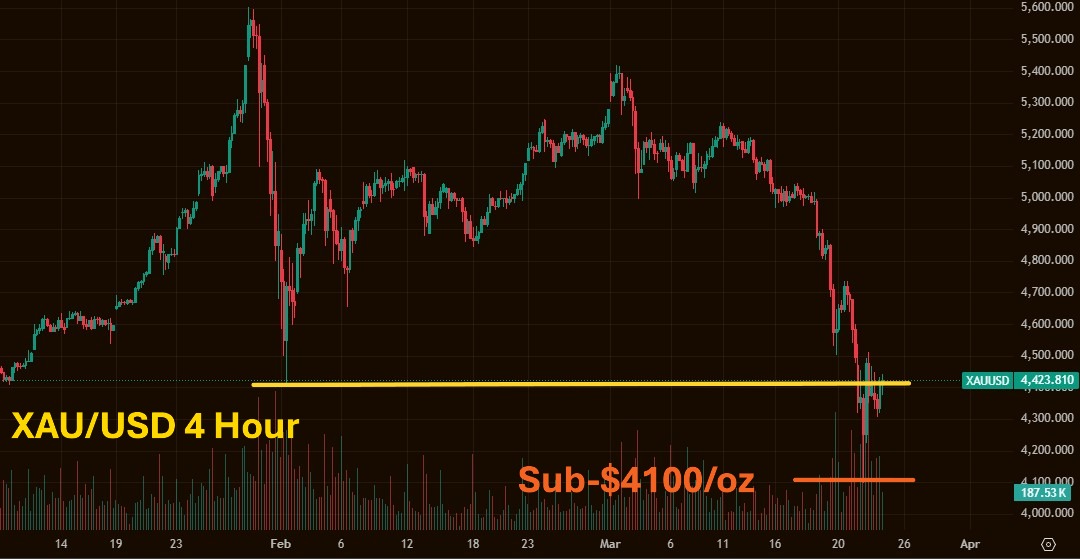
23-24 March 2026
Gold hits extreme volatility, dipping sub-$4,100/oz before bouncing back to $4,500/oz. Inverse correlation persists, with gold dropping and oil climbing.
View full price chart
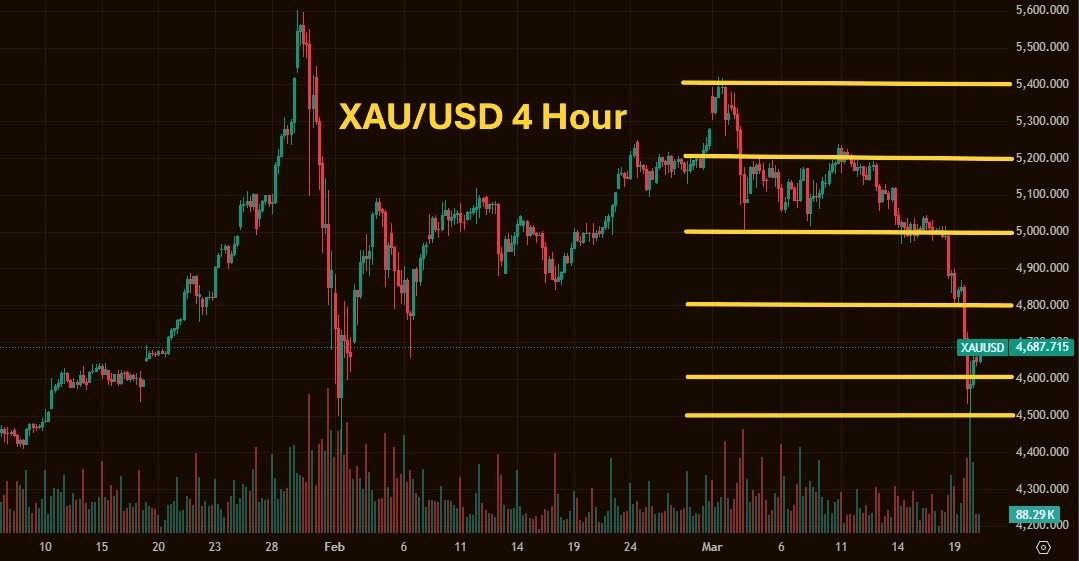
19 March 2026
Gold turns bearish around the FOMC as rising oil prices stoke inflation fears, highlighting a strong inverse gold–oil relationship.
View full price chart
9 March 2026
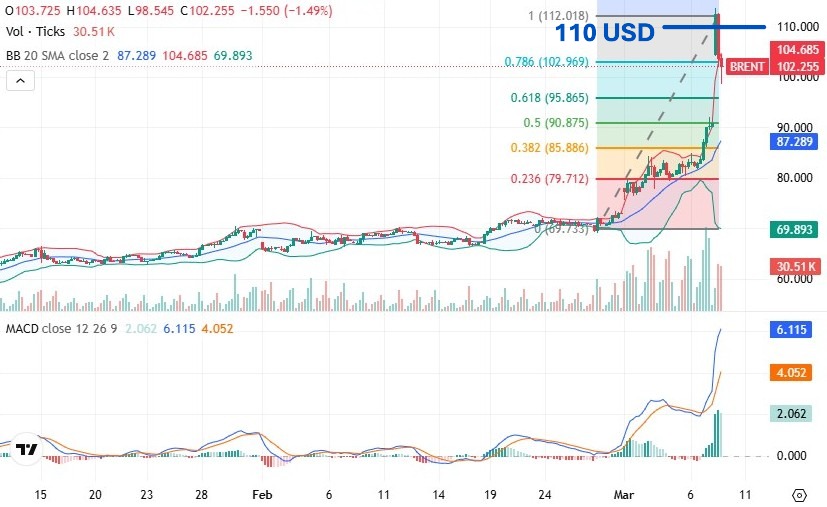
Brent crude briefly climbed above $116 a barrel, with bullish momentum intact.
View full price chart
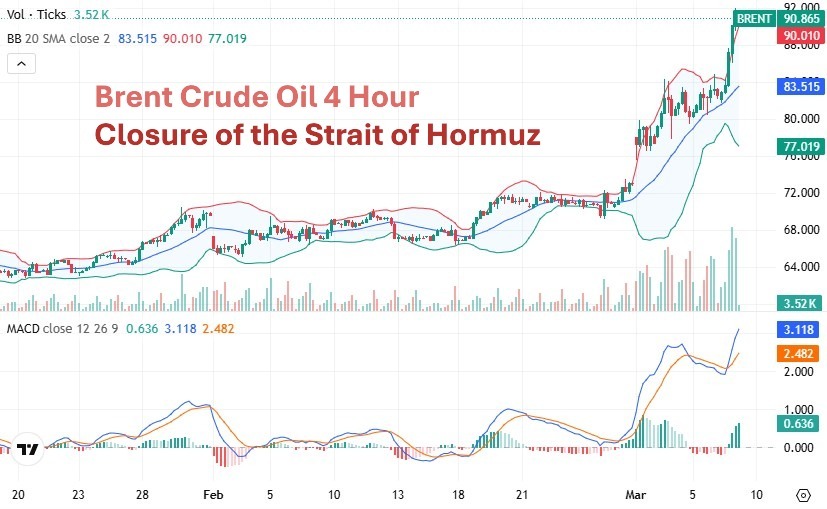
6 March 2026
The temporary closure of the Strait of Hormuz disrupted crude oil shipments, with supply shortages further driving oil prices higher.
View full price chart
6 March 2026
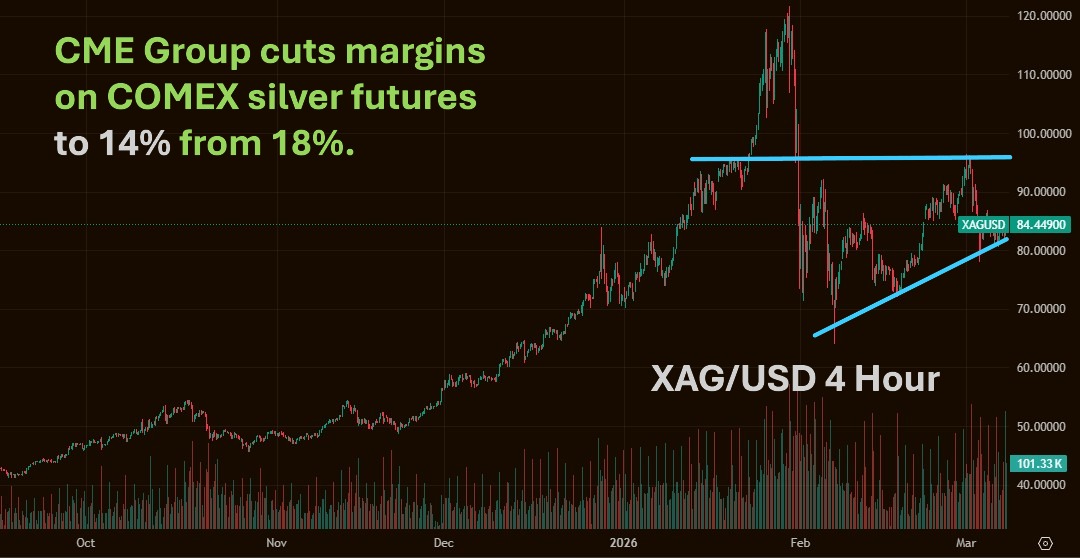
CME Group margin cuts lift COMEX silver futures. Spot silver hits $85/oz.
View full price chart
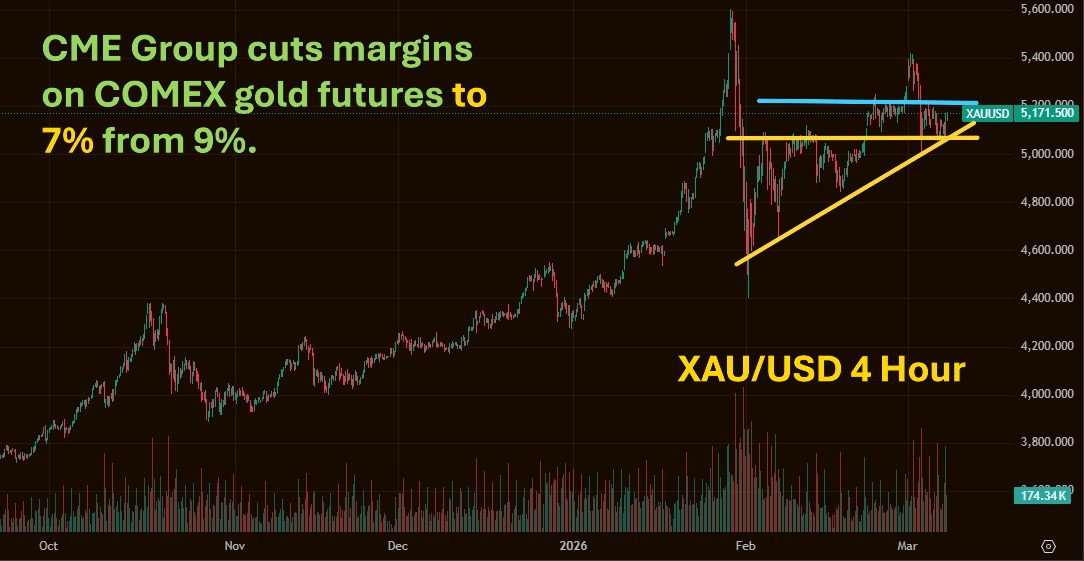
6 March 2026
CME Group margin cuts lift COMEX gold futures. Spot market shows early signs of bullish momentum.
View full price chart
3 March 2026
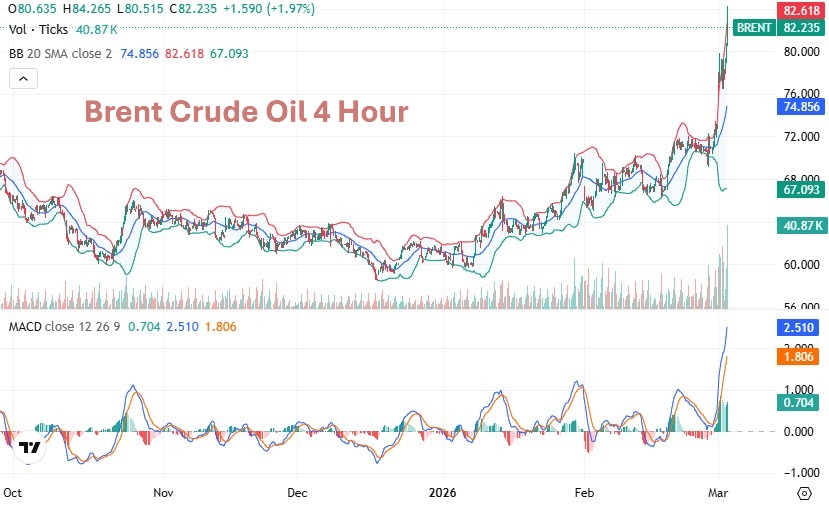
Crude oil continues to bid aggressively as U.S.–Iran military tensions fuel upside momentum.
View full price chart
27 February 2026
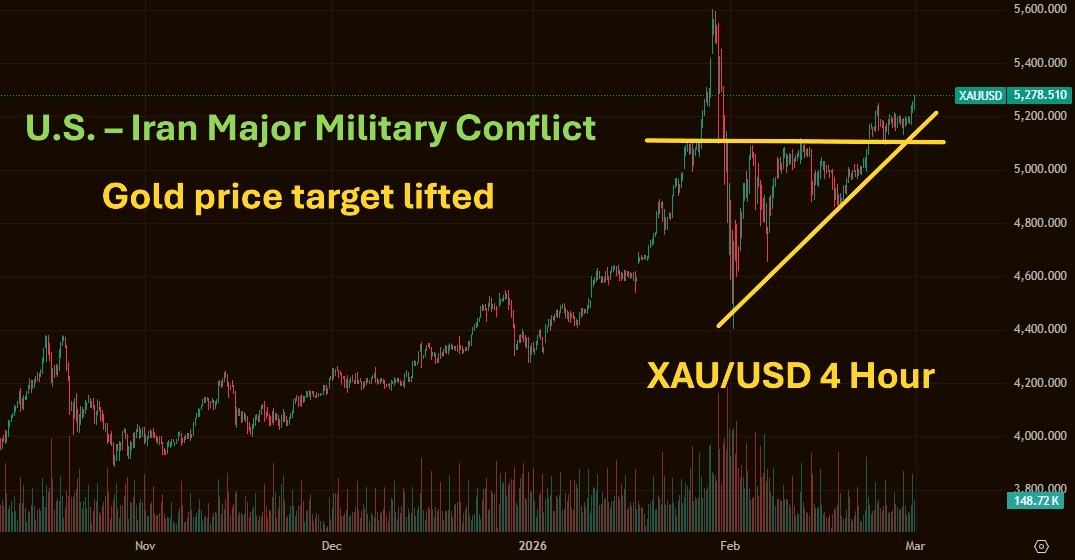
Gold accelerated above $5,270/oz as geopolitical risk premia widened on mounting U.S.–Iran conflict concerns.
View full price chart
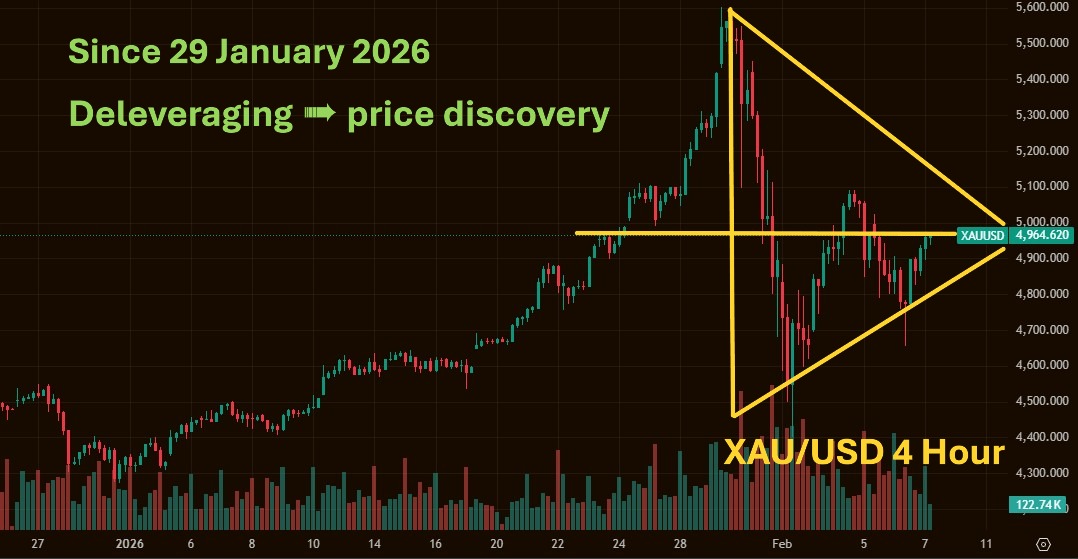
CME Group (Chicago Mercantile Exchange) margin hikes (9%) sparked systematic deleveraging in COMEX gold futures. Spot market liquidity was squeezed for a rapid crash.
View full price chart
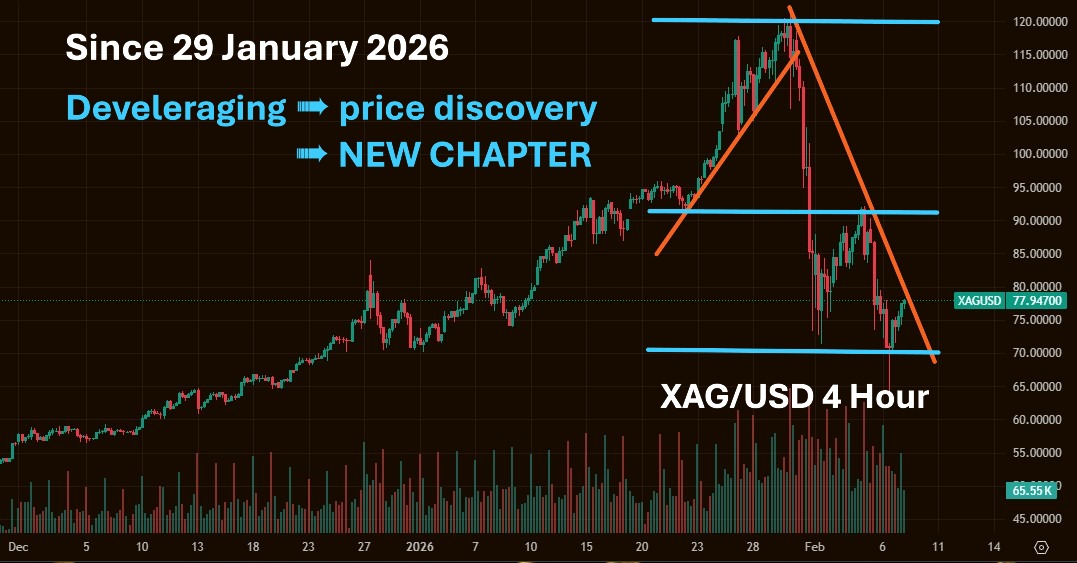
CME Group (Chicago Mercantile Exchange) margin hikes (18%) sparked systematic deleveraging in COMEX silver futures. Silver spot is awaiting a new phase of price discovery.
View full price chart
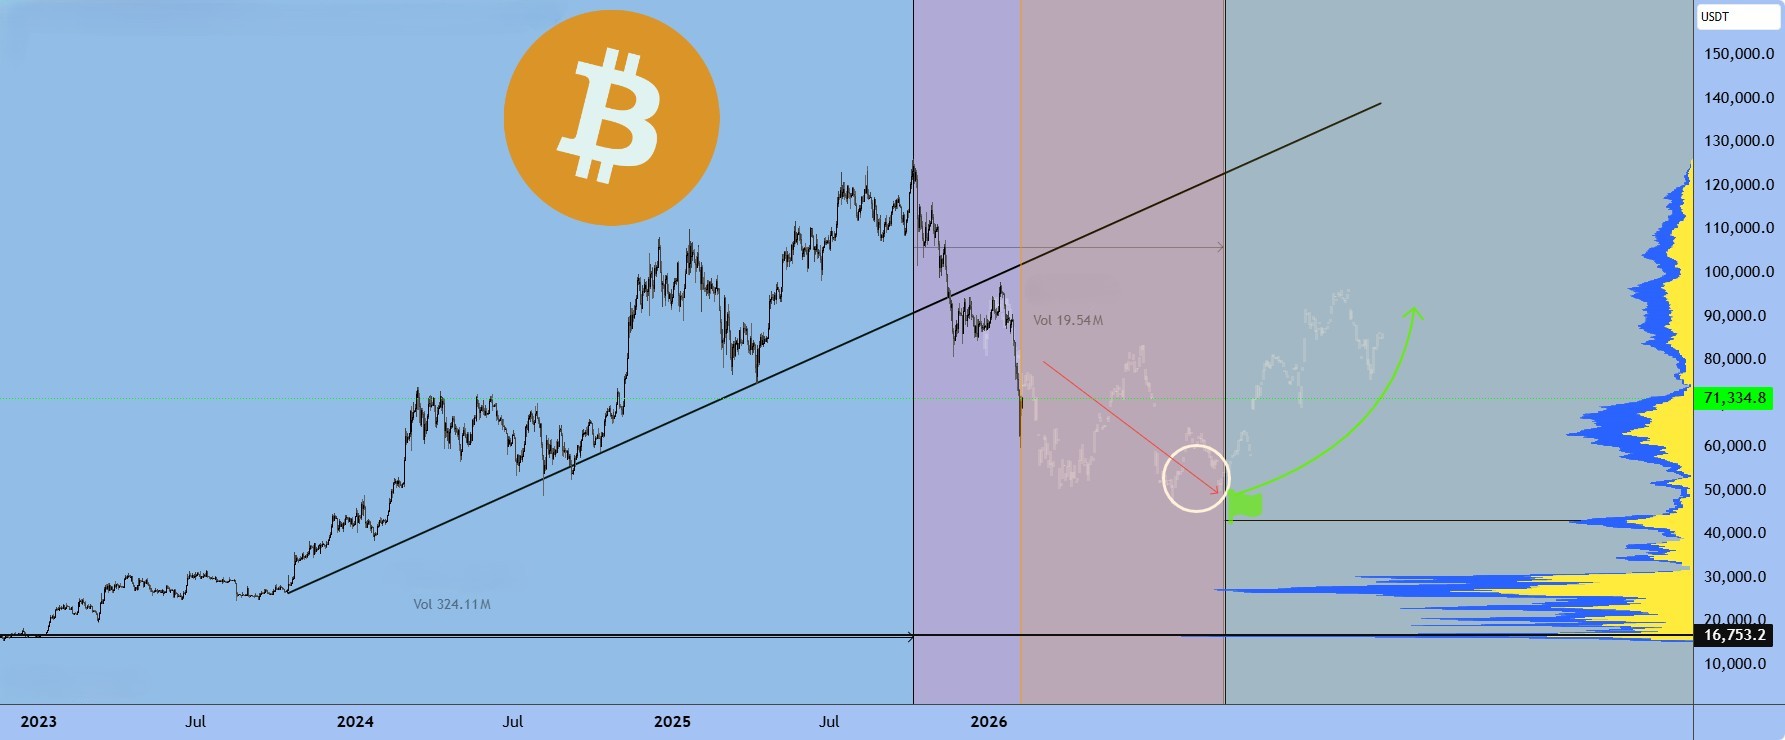
In early February 2026, Bitcoin tumbled below USD 63,000, falling to around half its all‑time high of about USD 126,000.
View full price chart
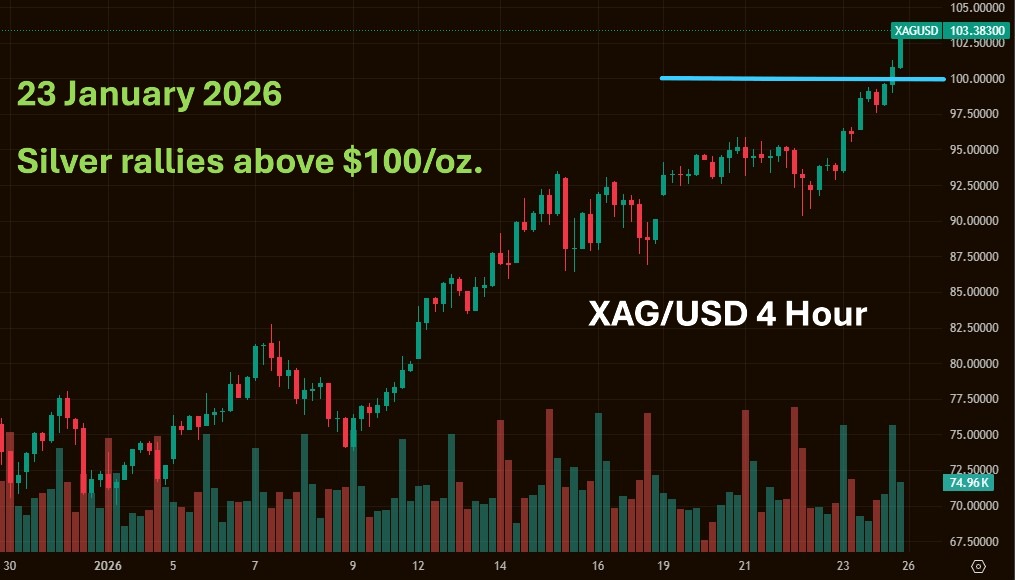
Silver rallies above $100/oz, with the gold-to-silver price ratio approaching 50.
View full price chart
Inventory shortages are pushing silver toward USD 100 per troy ounce.
View full price chart
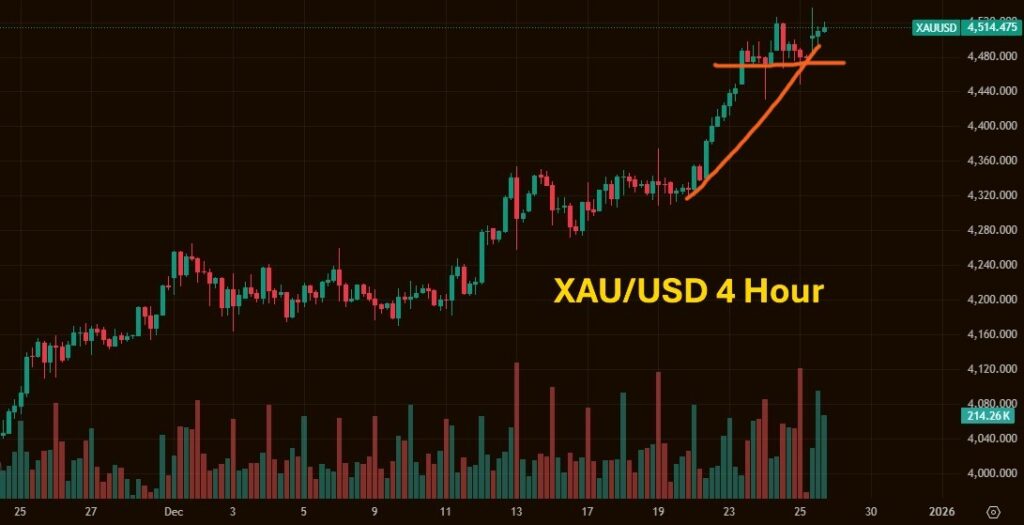
Gold surged past $4,500/oz, fueled by strong bullish momentum.
View full price chart
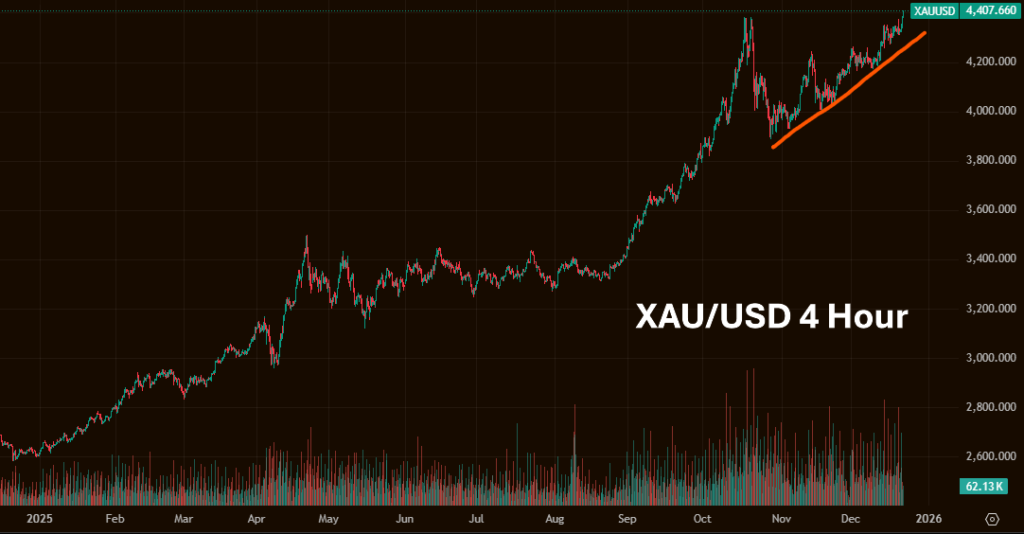
Gold surged past the resistance level of USD 4,400 per troy ounce, hitting a new record high.
View full price chart
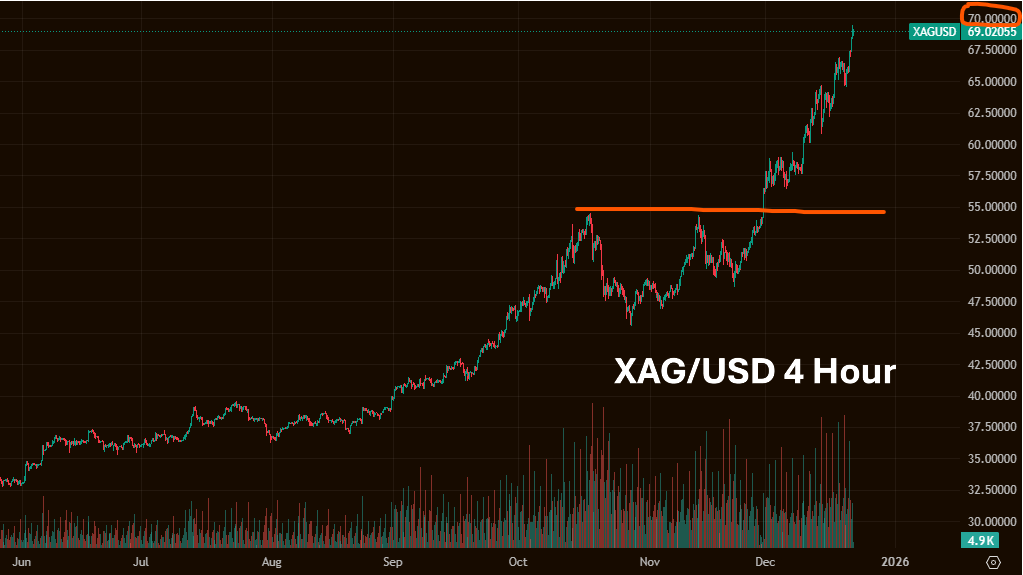
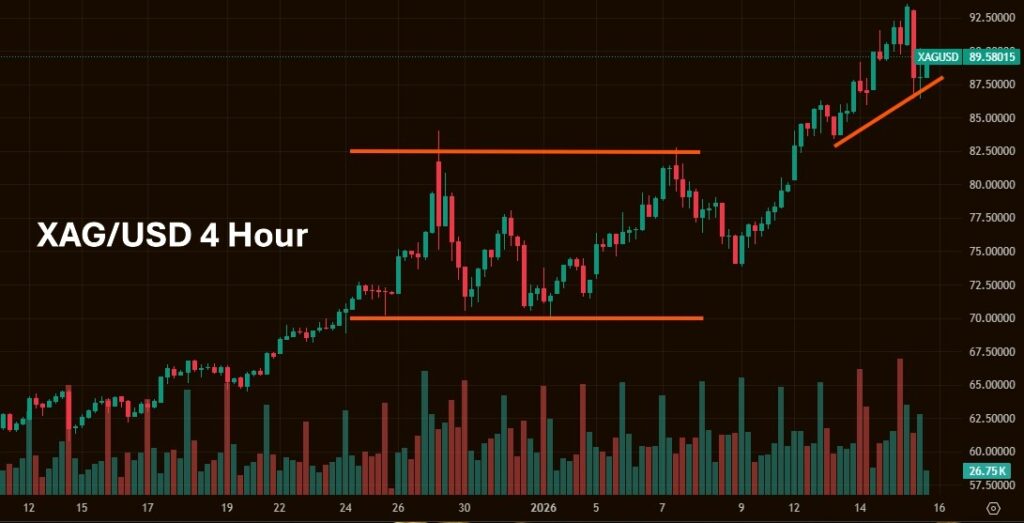
Silver is showing strong bullish momentum, with the potential to reach USD 70 – 80 per troy ounce.
View full price chart
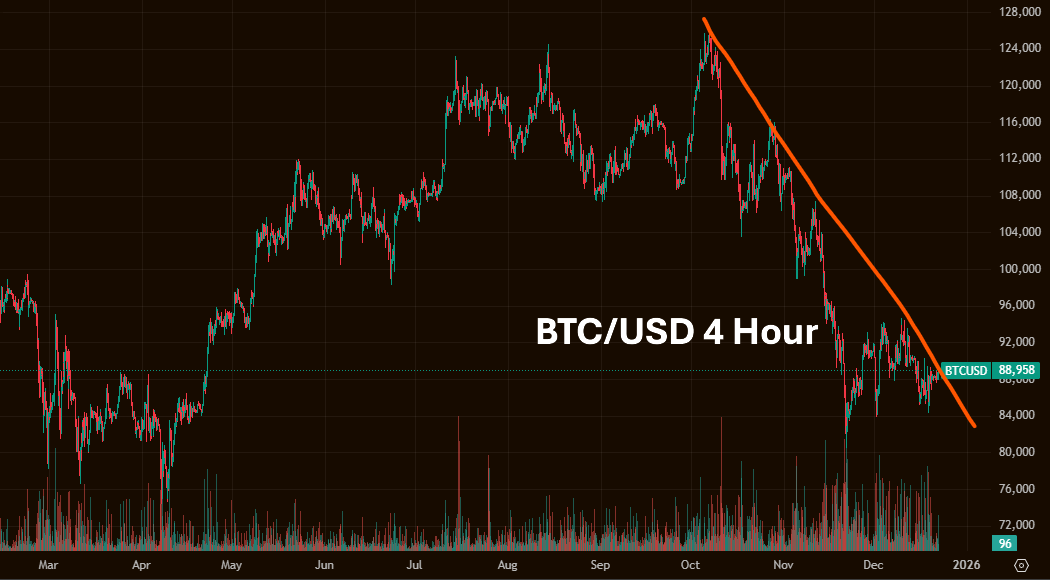
BTC is currently in a consolidation phase, bouncing between support and resistance.
View full price chart
DISCLAIMER: All comments made by upgradetier.space are for informational purposes only and are general in nature. They should not be construed as investment advice regarding the purchase or sale of any securities or financial instruments of any kind. Please consult your financial adviser before making any investment decisions related to securities or financial instruments mentioned by upgradetier.space. upgradetier.space assumes no responsibility for your trading or investment results.